

Saturday, June 30, 2012
10 Year Treasury Yield Since 1877
This is one of the most important charts in all of modern finance. The yield of the 10 year treasury bond going back to 1877.

Thursday, June 28, 2012
How Many Americans are Below 133% of the Federal Poverty Level?
I promise this will be my last constitution/healthcare relevant post today...
A portion of the healthcare law that was loosened by the Supreme Court revolved around Medicaid. The Supreme court ruled that the Federal government could not withhold funding to States that choose not to increase the scope of their Medicaid programs to include all those who have income below 133% of the Federal Poverty Limit (FPL). Below is a chart of the population of the US broken down relative to the poverty limit.

The chart includes buckets up to 138% of FPL. There are 88m Americans below that level. The current non-elderly Medicaid population is 45m, implying that if all states adopt the expanded Medicaid limits the medicaid population could increase by 30-40m people. Currently Medicaid spend is about $4000 per covered per year. On the low end, an incremental 30m people would cost $120B per year at that rate. State and Local governments have combined budgets of $2.1T per year, so $120B would be ~5% increase in spending.
Amendment XVI
Amendment 16 - Status of Income Tax Clarified. Ratified 2/3/1913. Note History
The Congress shall have power to lay and collect taxes on incomes, from whatever source derived, without apportionment among the several States, and without regard to any census or enumeration.
The Congress shall have power to lay and collect taxes on incomes, from whatever source derived, without apportionment among the several States, and without regard to any census or enumeration.
Article I Section 9
Section 9 - Limits on Congress
The Migration or Importation of such Persons as any of the States now existing shall think proper to admit, shall not be prohibited by the Congress prior to the Year one thousand eight hundred and eight, but a tax or duty may be imposed on such Importation, not exceeding ten dollars for each Person.
The privilege of the Writ of Habeas Corpus shall not be suspended, unless when in Cases of Rebellion or Invasion the public Safety may require it.
No Bill of Attainder or ex post facto Law shall be passed.
(No capitation, or other direct, Tax shall be laid, unless in Proportion to the Census or Enumeration herein before directed to be taken.) (Section in parentheses clarified by the 16th Amendment.)
No Tax or Duty shall be laid on Articles exported from any State.
No Preference shall be given by any Regulation of Commerce or Revenue to the Ports of one State over those of another: nor shall Vessels bound to, or from, one State, be obliged to enter, clear, or pay Duties in another.
No Money shall be drawn from the Treasury, but in Consequence of Appropriations made by Law; and a regular Statement and Account of the Receipts and Expenditures of all public Money shall be published from time to time.
No Title of Nobility shall be granted by the United States: And no Person holding any Office of Profit or Trust under them, shall, without the Consent of the Congress, accept of any present,Emolument, Office, or Title, of any kind whatever, from any King, Prince or foreign State.
Article I Section 8
Section 8 - Powers of Congress
The Congress shall have Power To lay and collect Taxes, Duties, Imposts and Excises, to pay the Debts and provide for the common Defence and general Welfare of the United States; but all Duties, Imposts and Excises shall be uniform throughout the United States;
To borrow money on the credit of the United States;
To regulate Commerce with foreign Nations, and among the several States, and with the Indian Tribes;
To establish an uniform Rule of Naturalization, and uniform Laws on the subject of Bankruptcies throughout the United States;
To coin Money, regulate the Value thereof, and of foreign Coin, and fix the Standard of Weights and Measures;
To provide for the Punishment of counterfeiting the Securities and current Coin of the United States;
To establish Post Offices and Post Roads;
To promote the Progress of Science and useful Arts, by securing for limited Times to Authors and Inventors the exclusive Right to their respective Writings and Discoveries;
To constitute Tribunals inferior to the supreme Court;
To define and punish Piracies and Felonies committed on the high Seas, and Offenses against the Law of Nations;
To declare War, grant Letters of Marque and Reprisal, and make Rules concerning Captures on Land and Water;
To raise and support Armies, but no Appropriation of Money to that Use shall be for a longer Term than two Years;
To provide and maintain a Navy;
To make Rules for the Government and Regulation of the land and naval Forces;
To provide for calling forth the Militia to execute the Laws of the Union, suppress Insurrections and repel Invasions;
To provide for organizing, arming, and disciplining, the Militia, and for governing such Part of them as may be employed in the Service of the United States, reserving to the States respectively, the Appointment of the Officers, and the Authority of training the Militia according to the discipline prescribed by Congress;
To exercise exclusive Legislation in all Cases whatsoever, over such District (not exceeding ten Miles square) as may, by Cession of particular States, and the acceptance of Congress, become the Seat of the Government of the United States, and to exercise like Authority over all Places purchased by the Consent of the Legislature of the State in which the Same shall be, for the Erection of Forts, Magazines, Arsenals, dock-Yards, and other needful Buildings; And
To make all Laws which shall be necessary and proper for carrying into Execution the foregoing Powers, and all other Powers vested by this Constitution in the Government of the United States, or in any Department or Officer thereof.
Wednesday, June 27, 2012
How Big Can Amazon Get?
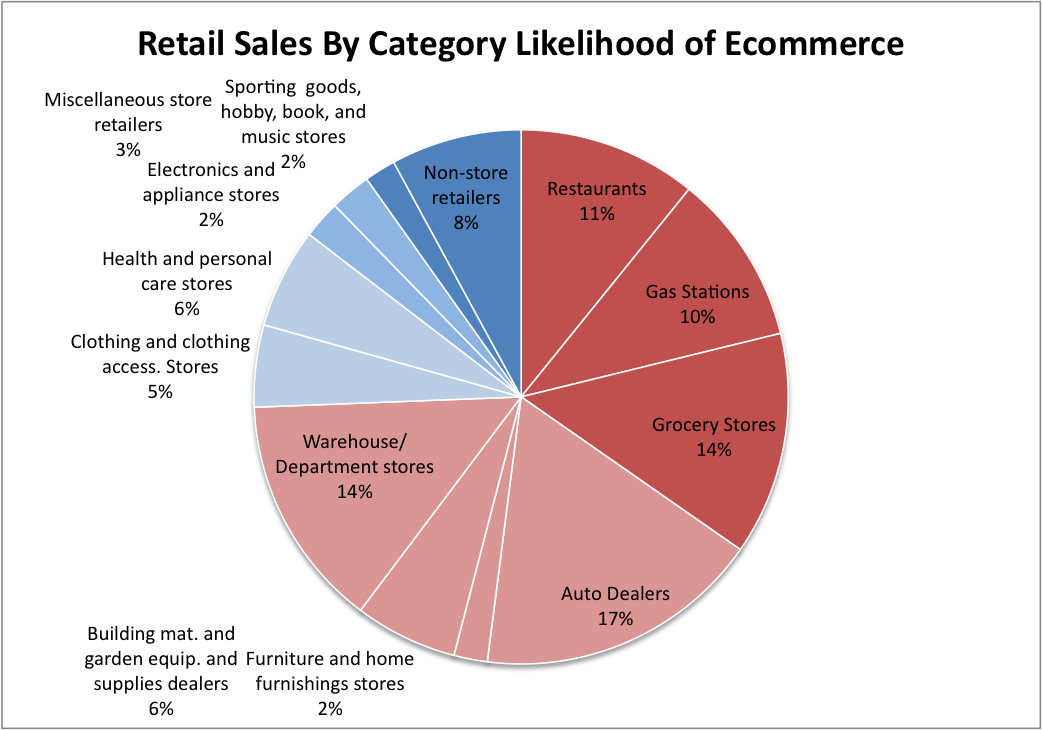
After a brief malaise, AMZN's stock has started to outperform the market again. It now sports a market cap of over $100B. WMT, by contrast, which does almost 10x AMZN's sales, has a market cap that is only 2.3x AMZN's. The AMZN thesis continues to be that internet retailing will take more and more share from brick and mortar and that AMZN will be the dominant online site. E-commerce sales are now just below 5% of total US retail sales.


Still, there are certain consumption expenditures that are highly unlikely to ever move online (e.g. Restaurants, Gas and Groceries). Below is a chart of US retail sales broken down by category and likelihood of online spend. Red categories are those that I subjectively labeled as unlikely to be purchased online, blue are those that are more likely to have some share online. I've faded the color on categories that may lean one way or the other. By my analysis, nearly 3/4 of US retail sales are unlikely to be made online. Only a portion of the remaining 25% is likely to be spent online too.
US retail sales are ~$4T. WMT sells for 0.5x sales, implying that AMZN would need to do $200B worth of sales to justify its current market cap with WMT's multiple. AMZN has ~25% of e-commerce market share with $40B+ in sales, so if it keeps that market share, online sales would need to be about $800B to justify AMZN's current market cap. That's 20% of current US retail sales.
Tuesday, June 26, 2012
Growth Stock Graveyard
In the past 6 months there have been more than a few former momentum darlings that have completely broken down. For some value investor schadenfreude, below are the charts of TPX, NFLX, DECK and GMCR. And for a blast from the past, two old favorites: CROX and KKD are also included. It took about 1.5 years for CROX to bottom, while Krispy Kreme took about 2 years before it reached a near term bottom. KKD went from 7x book value to 1.9. CROX went from 13x book to 0.3x. By comparison:


Monday, June 25, 2012
Historical Spread of US and German Interest Rates
While US Treasuries continue to trade at a discount to German Bunds, the spread has narrowed in recent weeks. A long term chart of the spread between Treasuries and Bunds is below. Since 1980 Treasuries have typically traded at a premium with a few periods of discount.


Months Supply of Housing
New Home sales data was reported this morning slightly better than estimates at 369k on a seasonally adjusted annualized rate in May vs. 343k for April. At that pace, there are 4.7 months of supply of new houses, which is the lowest level since 2005. That's still a little elevated compared to where supply was in the 90s, but it's much better than it was in 2009 when the figure peaked at 12.2. On average, the housing market has carried 6.6 months of supply since 1963.


Friday, June 22, 2012
Global Rig Count Chart
As an addendum to the domestic rig count chart, below is an international rig count chart since 1975.


North American Rig Count Chart
Long term chart of BHI data on the number of active rigs in the US. With oil prices falling one would expect this number to fall as well. It's an important data-point for oil service companies.


Wednesday, June 20, 2012
S&P 500 Without Fed Day Performance
To continue the analysis of the last post, below is what the S&P 500 would look like if you excluded the performance of the index on FOMC days. If you exclude the daily performance of the S&P on FOMC days, the index would be at 1121, 17% lower than it is currently.


Note that this is really more of just an interesting hypothetical analysis rather than a statement of where the S&P would be without the Fed. It's not really proper analysis to pretend that certain days didn't exist. Still there are lots of people out there who like to justify buy and hold investing by referring to charts of what the S&P 500 would look like if you weren't invested on the best single days.
What is the Historical Performance of the S&P 500 on Fed Days?
FOMC meeting days are some of the more volatile market trading days. Wild market swings are commonplace, especially in the last 5 years. Below is data of the S&P 500's performance on Fed days, both in terms of overall change and intraday change from low to high. Over the last 5 years the S&P 500 was positive on ~70% of days on which the Fed spoke. On these days, the S&P was up an average of 0.77%, which is much better than the effectively flat daily performance on all other days. Intraday, the S&P moves by about 40 bps more on Fed days than non-Fed days from as measured from the low point to the high point. That works out to about 50 points in Dow terms.

Tuesday, June 19, 2012
NYSE Share Turnover Since 1900
Since there's been a lot of talk recently about how light volume has been on US exchanges, I was doing a little research into historical volume trends. At the NYSE's website I found a data series which was one of the more interesting datapoints I've seen in a long time. It's a long term time series of turnover on the NYSE. Turnover is defined as number of shares traded per year divided by total number of shares listed. Turnover has fallen significantly in the last several years from a peak of 138% per year in 2008 to 73% per year currently. This turnover is up significantly from the mid 20th century when turnover rates were consistently in the low teens. But interestingly, turnover was at its highest at the beginning of the 20th century, when high frequency trading wasn't even conceivable.


Friday, June 15, 2012
2Q12 ≈ 2Q10
There's been plenty written about how 2012 is looking a lot like 2011 and 2010, but just to drive the point home once more, below is a chart of the S&P 500 in 2Q for 2010 vs. 2012. The pace of the decline in 2012 has tracked the decline in 2010 almost week for week. If the pattern holds, we should see a late June pullback before an early July rally.


How Much Did Zimbabwe's Money Supply Grow Before Hyperinflation?
Central Banks are reportedly getting geared up for coordinated stimulus if Greek elections don't go well. While it's tough to say what the exact response would be, or whether there will actually be one, the result would be a further attack on global currencies. For a reminder of what can happen when Central Banks systematically attack their own currency, below is the extreme example of Zimbabwe. The chart shows the growth in the monetary base through 2006. In the initial stages of the inflation, the base increased by 6x, compared to 3x in the US in the most recent period. In Zimbabwe the base would spike even further than this as hyperinflation really began to take root in 2008.


Thursday, June 14, 2012
Economic Data Recap: June 16, 2012
Initial Jobless Claims
Consumer Price Index
Current Account Deficit
Federal Reserve Balance Sheet
Chinese M2 vs. US M2
In browsing economic data, I came across an interesting datapoint: China's M2 is greater than the US M2. The Chinese have 90T Yuan in M2, which works out to a little over $14T. Meanwhile the US has a little under $10T in M2. This is pretty surprising considering that the Chinese economy is still roughly 1/3 the size of the US'. Since M2 is a measure of all the base money and most types of deposits in an economy, this is probably more a statement on the structure of the Chinese financial system than wealth. Whereas Americans keep more of their wealth in capital markets, Chinese probably keep more money in the banking system, boosting M2.


Wednesday, June 13, 2012
Dow Performance in Election Years
Last year there was a lot written about how in the 3rd year of a presidential term equity markets have had abnormally high returns. Perhaps because this didn't hold true last year, I haven't seen quite as much written about how markets have done in an election year for 2012. Below is the data for returns of the Dow in election years. Overall, the Dow has returned 7.55% on average in election years, which is not too far away from the long term average of 7.22%.
When the data is broken down for years in which the Presidency was handed off between parties though, the data changes a lot. In years that the Presidency shifted from a Democrat to a Republican or vice-versa the Dow has averaged a negative 4.5% return. Woodrow Wilson, Franklin Roosevelt, Harry Truman and Ronald Reagan are the only 20th century presidents to survive re-election with a negative Dow. Two of those Four were re-elected with the country on the brink of war, and Dewey famously "defeated" Truman, so Obama had better hope for a rally between now and November or otherwise start a war.

When the data is broken down for years in which the Presidency was handed off between parties though, the data changes a lot. In years that the Presidency shifted from a Democrat to a Republican or vice-versa the Dow has averaged a negative 4.5% return. Woodrow Wilson, Franklin Roosevelt, Harry Truman and Ronald Reagan are the only 20th century presidents to survive re-election with a negative Dow. Two of those Four were re-elected with the country on the brink of war, and Dewey famously "defeated" Truman, so Obama had better hope for a rally between now and November or otherwise start a war.

Retail Sales vs. GDP
Retail sales were reported to be negative for the second month in a row in May. The data was affected by falling gas prices: gas station sales were down 2.2%. Still, there were other negative categories as well including building supplies and healthcare stores.
The implications of two months of declining retail sales is not good for 2Q GDP, but doesn't necessarily mean GDP will be negative. Below is a comparison of quarterly GDP and retail sales since 1992. Of the 15x that retail sales have been negative for a full quarter since 1992, GDP has been negative 6, or 40% of the time.

The implications of two months of declining retail sales is not good for 2Q GDP, but doesn't necessarily mean GDP will be negative. Below is a comparison of quarterly GDP and retail sales since 1992. Of the 15x that retail sales have been negative for a full quarter since 1992, GDP has been negative 6, or 40% of the time.

Tuesday, June 12, 2012
Global Map of Government Debt to GDP
Most people should know by now that governments all over the world have a lot of debt and that the governments of developed nations are in the worst shape of any. Nothing drives that point home better than an info-graphic. Below is a map of the world shaded for government debt to GDP ratios. It's from 2009 because in 2010 many countries mysteriously stopped reporting up to date data to the World Bank.


Are Banks Lending?
At least one sign that the US banking system is significantly healthier than it was a few years ago is that loans have continued to grow steadily in 2012. Several years ago, we spent a lot of time concerned about whether and when US banks would ever start lending again and why they weren't lending.

The Y/Y increase in loans is slower than it has been in the past, but at least its positive and shows that banks are getting back to business as usual.


The Y/Y increase in loans is slower than it has been in the past, but at least its positive and shows that banks are getting back to business as usual.

Top 10 S&P 500 Stocks YTD
With 2012 almost halfway over, below is a list of the 10 best performing stocks so far this year.


Monday, June 11, 2012
Spanish Unemployment
A primary metric that Spain bears will point to is that the unemployment rate in Spain is the highest among its peers. The IMF quotes the rate at 19.7%, but it is often reported to be in the 25% range. The methodology to calculate unemployment can vary widely from country to country, making it more difficult to compare the metric across countries. In order to normalize the effect of differences in method, a broader employment to total population metric is shown below. Spain fares slightly better on this basis.


How Does Spanish Debt Compare to the Rest of the World?
Spain may be the latest recipient of a 100B Euro bailout, but compared to many other countries in the Eurozone, face value debt metrics aren't quite as bad for Spain. Government debt to GDP in Spain is 70%, which is the lowest of any PIIGS nation and lower than Japan, Germany, France and the US.


In terms of deficit, Spain looks better than a few other countries also, most notably the US.

Wednesday, June 6, 2012
June Investor Letter
Below is a letter that is written monthly for the benefit of Avondale Asset Management's clients. It is reproduced here for informational purposes for the readers of this blog.
Dear Investors,
Dear Investors,
The dichotomy of sentiment surrounding capital markets this year has certainly been something to be marveled at. Markets rocketed higher in January, February and March only to come crashing back down in April and especially May. The first quarter of 2012 was the 8th best in 50 years, but the second quarter is on pace to be the 5th worst. Once up 15% for the year, the S&P 500 is now only up 4% and the Dow has fallen into negative territory.
I’m happy to say that although we were a little early in positioning ourselves for this correction, we did hold our ground as the market rose in March and thus were well positioned for the substantial decline that we saw in May. While our holdings declined in market value along with everything else, we lost less than the market did, which is a huge positive. It’s never fun to look at our accounts and find them marked lower than they were at certain points during the year, but the substantial cash position that we have held allows us to reinvest at much lower prices and take advantage of declines. We started to buy heavily in late May and will continue to make purchases as the market presents opportunity. As a result of the decline there is plenty of opportunity.
In February and March I wrote that it was difficult to find stocks that looked attractive on a long-term basis. That changed in May, and today many of the stocks that I analyze appear to be selling at 30-50% discounts to where I believe they could be valued just 12-18 months from now. Of course, near term market fluctuations are difficult to predict, and so there’s a good chance we may have to wait patiently for these gains to materialize. But at least I feel confident that the prices we are paying today for our companies are favorable to us on a multi year horizon.
Even though I’m very happy with how we did in May, we certainly weren’t without fault. In particular, I don’t feel that I sold enough of some holdings as markets hit year to date highs. Additionally, commodity related investments suffered a particularly harsh beating last month. Driven by what I saw as favorable valuation relative to other opportunities, I unfortunately let these investments become too dominant in some portfolios. I learned the hard way that cheap can get cheaper. Now that these assets have already been marked lower though, I don’t think that we need to sell them. By my math, most of these companies are already forecasting a particularly harsh economic scenario that I am not expecting to come to pass.
In terms of economic outlook, all of a sudden I find myself significantly more optimistic than most others in the market even though my outlook hasn’t really changed much at all. So far, the data I’m looking at isn’t indicating that we are experiencing anything other than a typical seasonal slowdown in the context of continued cyclical expansion. If anything, recent declines in commodity prices bode well for future economic activity. Lower oil prices are a meaningful stimulus to the US consumer, and, importantly, open the door for the Chinese to loosen monetary policy for the first time in several years. Still, Europe is a real problem. I have been as vocal as anyone regarding the secular headwind that global sovereign debt poses, but I think in the medium term I believe a sentiment rebound could overcome these concerns. I don’t believe recession is around the corner quite yet.
Opinions voiced in the letter should not be viewed as a recommendation of any specific investment. Past performance is not a guarantee or reliable indicator of future results. Investing is subject to risk including loss of principal. Investors should consider the suitability of any investment strategy within the context of their personal portfolio. For more information on Avondale Asset Management, readers may be directed here.
I’m happy to say that although we were a little early in positioning ourselves for this correction, we did hold our ground as the market rose in March and thus were well positioned for the substantial decline that we saw in May. While our holdings declined in market value along with everything else, we lost less than the market did, which is a huge positive. It’s never fun to look at our accounts and find them marked lower than they were at certain points during the year, but the substantial cash position that we have held allows us to reinvest at much lower prices and take advantage of declines. We started to buy heavily in late May and will continue to make purchases as the market presents opportunity. As a result of the decline there is plenty of opportunity.
In February and March I wrote that it was difficult to find stocks that looked attractive on a long-term basis. That changed in May, and today many of the stocks that I analyze appear to be selling at 30-50% discounts to where I believe they could be valued just 12-18 months from now. Of course, near term market fluctuations are difficult to predict, and so there’s a good chance we may have to wait patiently for these gains to materialize. But at least I feel confident that the prices we are paying today for our companies are favorable to us on a multi year horizon.
Even though I’m very happy with how we did in May, we certainly weren’t without fault. In particular, I don’t feel that I sold enough of some holdings as markets hit year to date highs. Additionally, commodity related investments suffered a particularly harsh beating last month. Driven by what I saw as favorable valuation relative to other opportunities, I unfortunately let these investments become too dominant in some portfolios. I learned the hard way that cheap can get cheaper. Now that these assets have already been marked lower though, I don’t think that we need to sell them. By my math, most of these companies are already forecasting a particularly harsh economic scenario that I am not expecting to come to pass.
In terms of economic outlook, all of a sudden I find myself significantly more optimistic than most others in the market even though my outlook hasn’t really changed much at all. So far, the data I’m looking at isn’t indicating that we are experiencing anything other than a typical seasonal slowdown in the context of continued cyclical expansion. If anything, recent declines in commodity prices bode well for future economic activity. Lower oil prices are a meaningful stimulus to the US consumer, and, importantly, open the door for the Chinese to loosen monetary policy for the first time in several years. Still, Europe is a real problem. I have been as vocal as anyone regarding the secular headwind that global sovereign debt poses, but I think in the medium term I believe a sentiment rebound could overcome these concerns. I don’t believe recession is around the corner quite yet.
Scott Krisiloff, CFA
Opinions voiced in the letter should not be viewed as a recommendation of any specific investment. Past performance is not a guarantee or reliable indicator of future results. Investing is subject to risk including loss of principal. Investors should consider the suitability of any investment strategy within the context of their personal portfolio. For more information on Avondale Asset Management, readers may be directed here.
Productivity Long Term Historical Chart
1Q12 Labor Productivity was revised lower by the BLS today to -0.9% q/q. The fact that productivity fell is an extremely troubling sign for the economy because almost all real growth comes from getting more production from the same amount of labor. Without productivity gains, the only other source of economic growth is growth in population. 1Q's drop continues a troubling slowing of productivity growth in the US. A long term chart is below.


While the trend is still positive, the output per hour of labor has started to move sideways in recent years. Since 2005 the average yearly gain in productivity has been 1.6%. Between 1948 and 2005 the average gain was a full percentage point higher at 2.6%. To make things worse, the 2005-2011 period is skewed by a big increase in productivity in 2010 that is primarily attributable to job cuts rather than new technology or business processes. Excluding 2010, productivity has only grown by 1.3% per year since 2005. Make no mistake--the underlying root of the world's economic problems isn't debt, it's lack of productivity growth.

Tuesday, June 5, 2012
Fed Liquidity Swap Lines
Late last year the Fed re-opened some currency swap lines that it created in 2008 with foreign central banks in order to ensure that European banks would have access to dollars. Even though Europe is back in the headlines again, it's a positive sign for the European banking system that these swap lines continue to contract. The contraction implies that funding pressure is less acute than it was previously.


Monday, June 4, 2012
What is Mark Zuckerberg's Net Worth?
Facebook hit another new low today of $26.57, which is down 30% from its IPO price of $38. While investors who got in on the IPO and haven't gotten out are nursing wounds, Mark Zuckerberg is quite possibly feeling some pain of his own. His paper net worth has fallen by $6 Billion since the IPO, from $19B to $13B. He owns just over 500m shares, so every dollar price drop represents half a billion dollars in losses for him. Poor guy...


Saturday, June 2, 2012
Worst 2Q For S&P 500
Considering that the first quarter was the 8th best start to a year for the S&P 500 since 1957, it's pretty unbelievable that the 2nd quarter is on pace to end up on the opposite end of the spectrum. 2/3 of the way through the quarter, 2Q12 is on pace to be the 5th worst since 1957. As a refresher, out of 8 double digit first quarters since 1957, the index has never closed the year in negative territory, and it has only lost value between the end of the first quarter and the end of the year once: 1987.


Friday, June 1, 2012
Mayan Cross History
While the last post was tongue in cheek, I thought it might be interesting to look back at the history of when a 50 month moving average has crossed the 200 month moving average just to see how rare an occurrence this actually is. As you can probably guess, this has really only happened in two market periods: the depression and the 70s. During the depression, the cross occurred at the beginning of the period and didn't reverse itself until 1945, after World War II had ended.

In the 70s, the convergence followed a pattern more similar to the one that has occurred in the recent period. Following a protracted sideways move in the Dow, the averages finally converged in 1978, but didn't really diverge again until 1982.


In the 70s, the convergence followed a pattern more similar to the one that has occurred in the recent period. Following a protracted sideways move in the Dow, the averages finally converged in 1978, but didn't really diverge again until 1982.

The Mayan Apocalypse Cross
The S&P 500 is back below the 200 day moving average today, which is significant in some circles. The good news for these 50/200 day moving average watchers though is that we haven't yet experienced the dreaded "death cross" when the 50 dma moves below the 200 dma.
The death cross (perhaps only exceeded by the Hindenburg Omen) has got to be one of the most ominously named trading patterns, but is there room for one more? What would happen if the 50 month moving average were to cross below the 200 month moving average? Given that the two averages seem to be converging just in time for December 2012, I propose the term: Mayan Cross.

The death cross (perhaps only exceeded by the Hindenburg Omen) has got to be one of the most ominously named trading patterns, but is there room for one more? What would happen if the 50 month moving average were to cross below the 200 month moving average? Given that the two averages seem to be converging just in time for December 2012, I propose the term: Mayan Cross.

Subscribe to:
Posts (Atom)